
Research
Why Treasury Doubled Its Long-Term Bond Buybacks: $520 Billion Offered, $42 Billion Taken, and an Exit Queue at 18 Times the Door (August 2026)
· By the ByShovel Research Desk
On August 18 Treasury paid 52 cents on the dollar for a bond it issued in 2021. The next morning it doubled the long-bond buyback window, the first change to those caps in the program's history. The wire stories covered the announcement; our ledger of every operation since 2000 shows what forced it: dealers offered $520 billion into the window this year, Treasury accepted $42 billion, and the line at the exit has been building for 2 years.
The US Treasury doubled its long-bond buyback window this month because its own results file shows a line at the exit that has been growing for 2 years while the door stayed the same size. On August 18, 2026, dealers offered $19.9 billion of 20-to-30-year bonds into a window allowed to buy $2 billion, and Treasury paid $52.38 per $100 of face value for one of the bonds it took. The next morning it announced the first change to the long-bond caps in the program's history: $2 billion per operation becomes at least $4 billion, effective September 9.
What is verified, from our own records
The Vault Report keeps its own record of every Treasury buyback operation ever run: 218 operations from March 2000 through August 25, 2026, with 5,833 security-level result rows carrying the price paid for each bond. Every figure in this piece was computed from that record this week, then cross-checked against a fresh pull of Treasury's published results feed, which matched our archive to the decimal. Three numbers carry the story:
- In 2026 through August 18, dealers offered $520.4 billion of long-term bonds (the 10-to-20-year and 20-to-30-year buckets) into the buyback window. Treasury accepted $42.2 billion.
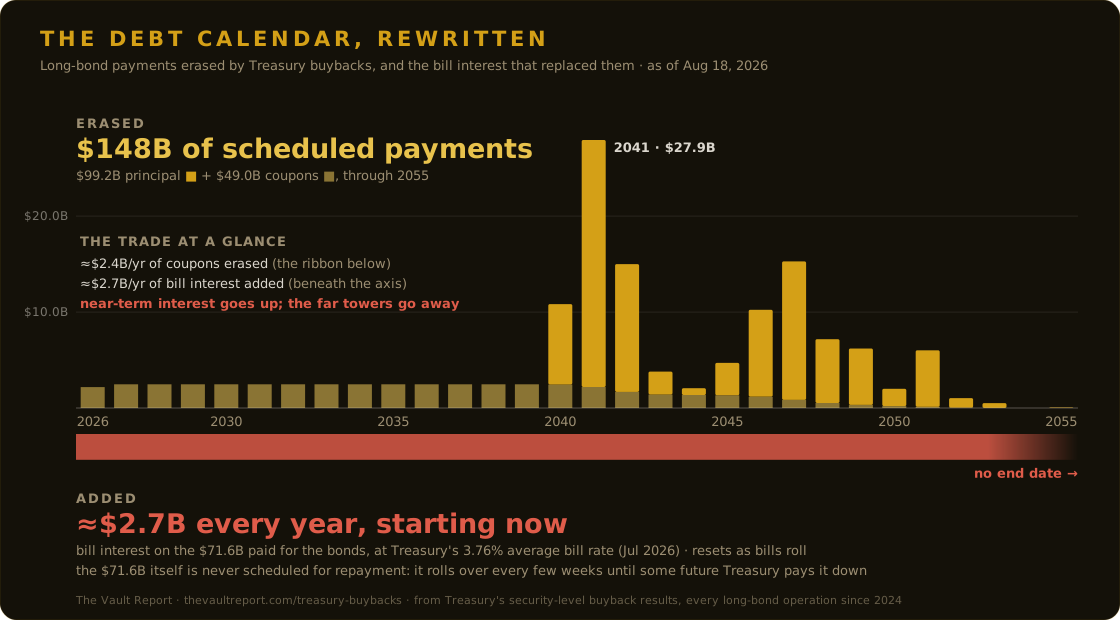
- Since the program's first long-bond operation in April 2024, dealers have offered $1.01 trillion at the long end. Treasury bought $99.2 billion of it, at an average of 72.2 cents per dollar of face value. The other $912 billion of offers went home unfilled.
- The heaviest day in the record: April 9, 2026, when dealers offered $36.5 billion against a $2 billion cap, 18.2 times the door. Two March operations ran it close at 18.0 times each.
The doubling was announced August 19 (Treasury press release), takes effect September 9, and runs through the November 4 refunding. Our Treasury buyback tracker carries every operation, price, and chart behind this piece, updated after each operation.
How a buyback works, and what the queue is not
The mechanics matter, because the number is easy to over-read. Roughly once or twice a week, Treasury names a maturity bucket (say, bonds with 20 to 30 years left to run), publishes the list of specific issues it will consider, and opens a window for about 20 minutes. Primary dealers, the banks obligated to make markets in Treasuries, submit offers: this bond, this face amount, this price. Treasury compares each offer to its own view of fair value and accepts only the ones priced attractively, up to a cap announced in advance, which at the long end has been $2 billion per operation since the program began.
Two things the queue is not. It is not a stockpile: the same bond can be offered again at every operation, so the $912 billion turned away measures 2 years of standing willingness to sell at these prices, not a warehouse of unsold paper sitting on dealer balance sheets. And an offer is not a surrender: it is a priced, two-way quote that Treasury can refuse. The clearest proof is March 19, 2026, one of the heaviest days in the record, when dealers offered 18 times the cap and Treasury accepted just $205 million of a possible $2 billion because the prices weren't attractive. The queue measures pressure at a price. That is exactly what makes its growth informative.
Two years of the same picture
Quarter by quarter, dealer offers as a multiple of window capacity at the long end: 2.1x in the program's first quarter (Q2 2024), then 3.7x, 3.0x, 7.2x, 9.5x, 10.5x, 12.8x, and 13.2x in the first quarter of 2026, the heaviest quarter since the modern program began. The yearly ledger:
- 2024 (9 operations, including the $200 million April trial run): $53.0 billion offered, $16.2 billion bought.
- 2025 (21 operations): $438.2 billion offered, $40.8 billion bought.
- 2026 through August 18 (22 operations): $520.4 billion offered, $42.2 billion bought.
Treasury's own announcement points at the same thing our chart shows. The August 19 release explains the doubling as a response to "the significant volume of high-quality offers Treasury routinely receives in longer-dated buyback operations." We agree, and would add only that the volume has been significant since the summer of 2024, and the caps did not move until it averaged $23.7 billion per operation against a $2 billion door.
Honesty requires the other direction too: the queue has cooled from its spring peak. After 13.2x in the first quarter, the second quarter of 2026 averaged 12.2x and the third is averaging 9.3x; the August 11 operation drew 3.7x, the lightest since November 2024. Whether that cooling reflects dealers finding better exits elsewhere, or this summer's yield levels making the discounts less painful to keep, isn't knowable from the results file. What is knowable: even the cooled quarter offers the window more than 9 times what it can take, and the day before the doubling was a 9.9x day.
What the window pays
Across its 27 months, the long-bond window has paid an average of 72.2 cents per dollar of face value, retiring bonds whose coupons average 2.50%. The coupon is the fixed cash a bond pays its holder every year, quoted against face value: a 2.50% coupon pays $25 a year per $1,000 of face, year after year until maturity, when the $1,000 comes back too.
The August 18 purchase shows why the discounts are arithmetic, not alchemy. Treasury sold the 1.875% bond of February 2051 at close to face value on February 16, 2021, when a 30-year auction cleared under 2% (ours shows the stop at 1.933%). Whoever holds $1,000 of it collects $18.75 a year, every year until 2051, then the $1,000 back. A new 30-year bond now pays about $52 a year per $1,000, so nobody will pay $1,000 for the old bond's $18.75 stream; its price falls until the cheap purchase, the fixed coupons, and the 2051 payoff together match the roughly 5.2% on offer next door. That happens at about $524 per $1,000, which is where Treasury took its $175 million of it: 52.38.
That was within 2 cents of the floor of the whole record: November 20, 2024, when the window accepted $25 million of the 1.375% bond of August 2050 at 50.41 cents on the dollar, the cheapest purchase in our records of both buyback eras.
The mirror: what this program was the last time it ran
Treasury has run buybacks once before, and the two programs are mirror images. From 2000 to 2002, running budget surpluses, it retired $67.5 billion of face value and paid $87.3 billion to do it: an average price of 129.4, because the bonds it was retiring carried coupons averaging 8.92%, some as high as 14%. Its cheapest purchase in those 3 years was at 99.9. It paid a premium to stop paying interest, with cash it actually had.
The modern program flips every sign. Since April 2024, Treasury has retired $439.0 billion of face value in conventional (non-inflation-linked) securities and paid $406.4 billion: 92.6 cents on the dollar on average, 72.2 at the long end, coupons averaging 2.90%. And the cash is not surplus. It is raised by issuing new debt, weighted toward short-term bills. The 2000 program was a payoff. The 2026 program is a swap: long debt with cheap coupons out, short debt at today's rates in.
The front door is not broken
A queue at the exit invites the conclusion that nobody wants long US debt. The front door says otherwise. Every 30-year auction since the start of 2024, 32 of them in our auction record, drew between $2.27 and $2.66 of bids per dollar sold. No failures, no collapse in coverage.
What moved is the price of showing up. The average winning yield at 30-year auctions climbed from 4.24% in the third quarter of 2024 to 5.14% this quarter, and the August 13 auction stopped at 5.216%, the highest in our auction archive, which begins in December 2011. Read together, the two doors state one fact twice: the market will still hold 30-year US debt at 2026 prices, and it increasingly declines to keep holding it at 2020 prices.
The debasement math, for readers here about gold
Metals readers mostly met this story through takes wiring the buybacks to gold's record-setting August as cause and effect, usually via the phrase "stealth QE." The mechanics don't support the phrase. QE is the central bank creating reserves to buy bonds; a buyback is Treasury retiring its own debt with cash raised by selling other Treasuries, at a discount to face value, with the Federal Reserve nowhere in the transaction. No new money enters the system. Wolf Street's August 19 piece called the program a swap of old cheap debt for new expensive debt, and on the arithmetic that is exactly right; our ledger just puts the full numbers on it.
The number that should interest a gold holder is on the funding side, and it runs the opposite direction from the headline. Buying $100 of debt for $52.38 sounds like profit, but the annual cash flows say otherwise: cancelling $100 of the 2051 bond's face saves $1.88 a year in coupons, while the $52.38 of new bills raised to pay for it costs about $2.10 a year at today's rates. The interest bill goes up on the trade. What Treasury gains is retiring face value cheaply and a better-functioning market; what it gives up is a rate locked until 2051, exchanged for one that resets every few months. Scaled up: the retired long bonds carried 2.50% coupons, the bills replacing them cost roughly 4% today, and bills now make up 22.2% of all marketable Treasury debt ($6.99 trillion of $31.46 trillion at July 31), above the 15-to-20% band Treasury's own advisory committee recommends. The world's largest borrower keeps shortening its own debt, which makes its interest bill increasingly a function of the next rate decision rather than the last decade's. That incentive structure, not the buyback window's mechanics, is the number worth watching. We'll publish the full coupon-swap interest ledger as its own piece.
The scoreboard we will check, and when
- September 9: the first long-bond operation at "at least $4 billion." Treasury Secretary Bessent has already said it could be "more than the 4 billion per issue," and described 30-year market liquidity as "very poor." We read the fill rate and the offer multiple against this page the same week.
- Every operation after: the buyback tracker updates within a day of each result, typically 1 to 2 operations per week through the quarter.
- The revised schedule: Treasury said on August 19 that an updated operation schedule would follow. As of August 28 it had not been posted. When it lands, the operation dates go on the tracker.
- November 4: the next Quarterly Refunding, where Treasury says it will set buyback sizes beyond this quarter. That decision, against whatever the September and October operations show, is the verdict on this article's read.
Method and receipts
Buyback figures are computed from The Vault Report's own archive of Treasury's published operation results: 218 operations since March 2000 and 5,833 security-level rows, ingested from the official Fiscal Data feed after each operation and re-verified against a fresh pull of that feed for this piece. Aggregation choices that matter: operations are identified by date and start time, because Treasury ran the same operation twice on August 21, 2024, and we count both; sums count only bonds actually bought; inflation-protected securities are excluded from every dollar and price figure in this piece (their prices need index adjustment); and prices are clean prices, so cash figures slightly understate settlement totals. Auction figures come from our own record of 321 auctions of the 10-, 20-, and 30-year, back to December 2011. The bills share of marketable debt is from Treasury's Monthly Statement of the Public Debt for July 31, 2026. Our 2026 long-bucket totals, $520.4 billion offered and $42.2 billion accepted, match the sector figures FXStreet cited independently on August 19.
Sources
- US Treasury: Treasury Announces Increased Sizes of Nominal Long-End Liquidity Support Buybacks Beginning September 9 (August 19, 2026)
- US Treasury: Quarterly Refunding Statement (August 5, 2026)
- Treasury Borrowing Advisory Committee: Charge 1, Q3 2025 (buyback program review recommending larger long-end operations)
- Treasury Fiscal Data: Buybacks Operations and Buybacks Security Details API endpoints (the source feed for our archive)
- Treasury Fiscal Data: Monthly Statement of the Public Debt (bills share of marketable debt, July 31, 2026)
- CNBC: Treasury announces upscaled buyback operation for longer-term debt, sending yields lower (August 19, 2026)
- CNBC: Bessent says Treasury buyback operation could be more than $4 billion (August 20, 2026)
- FXStreet: $20 billion offered, $2 billion taken: why Treasury doubled its buyback cap (August 19, 2026)
- Wolf Street: Bessent doubles Yellen's hocus-pocus Treasury buybacks (August 19, 2026)
- IMF Working Paper WP/25/88: Testing the Liquidity Support Effects of the U.S. Treasury Buyback Program (May 2025)
Frequently asked questions
- Why did the US Treasury double its buyback operations in 2026?
- Treasury raised its long-bond buyback caps from $2 billion to at least $4 billion per operation, effective September 9, 2026, after 2 years in which dealers consistently offered far more than the operations could buy. In 2026 through August 18, dealers offered $520.4 billion of 10-to-30-year bonds and Treasury accepted $42.2 billion. Treasury's August 19 announcement cited the significant volume of high-quality offers it routinely receives in longer-dated operations.
- Is the Treasury buyback program quantitative easing?
- No. Quantitative easing is the Federal Reserve creating bank reserves to buy bonds. In a buyback, Treasury retires its own debt using cash raised by issuing other Treasury securities, mostly short-term bills, and no new money is created. The closer parallel is a refinancing: debt with an average 2.50% coupon is retired at around 72 cents on the dollar of face value and replaced with bills at today's rates.
More questions
- What do Treasury buybacks mean for gold?
- Buybacks create no new money, so the direct link to debasement is weaker than the commentary suggests. The related number that matters for gold holders is the funding mix: retiring low-coupon long bonds with bill issuance has helped push bills to 22.2% of marketable US debt as of July 31, 2026, above the 15-to-20% band Treasury's own advisory committee recommends. A shorter debt profile ties the government's interest bill more tightly to near-term rate decisions, which is the incentive structure many gold holders are actually hedging.
- Are dealers stuck with $900 billion of bonds they cannot sell?
- No. The $912 billion is the cumulative face value of buyback offers Treasury has declined at the long end since April 2024, and the same bond can be offered at every operation, so it measures repeated willingness to sell at a price, not a stockpile. Offers are priced quotes Treasury can refuse: on March 19, 2026, dealers offered 18 times the cap and Treasury accepted only $205 million because the prices were too rich.
- When does the $4 billion Treasury buyback size take effect?
- September 9, 2026. The change applies to the 10-to-20-year and 20-to-30-year buckets at a size of at least $4 billion per operation, and runs through the current refunding quarter ending November 4, 2026, when Treasury says it will announce sizes beyond that. As of August 28, the revised operation-by-operation schedule had not yet been posted.
- Does the US government make money buying back its bonds at 52 cents on the dollar?
- Not in any cash sense. The discount is the market's fair price for a bond paying a 1.875% coupon in a 5% world, so Treasury swaps $52.38 of cash for obligations worth $52.38: face value falls, but no profit appears. The annual interest bill actually rises on the trade, because cancelling $100 of face saves $1.88 a year in coupons while the $52.38 of new bills that fund it cost about $2.10 a year. What Treasury gains is smaller face-value debt and better market liquidity; what it gives up is a rate locked until 2051, exchanged for short-term rates that reset every few months.