
Research
US Crude Sits in the 82nd Percentile and the 33rd at the Same Time, and Both Are Right
428.9M bbl on August 21 Is the 82.2nd Percentile of 2,292 Weeks Since 1982, the 33.2nd of 609 Weeks Since 2015, and 6.9M bbl Above Its Same-Week Five-Year Average
· By the ByShovel Research Desk
A percentile is a share of a named population, and the population is the whole claim. Against every week EIA has published since August 1982, 428.9 million barrels of commercial crude is a high reading. Against the 609 weeks since the shale build-out lifted the floor, it is a low one. Same barrels, both correct. The same-week seasonal check and the weekly-change rank are two more answers to two different questions, and this page keeps all four apart.
What we checked
- Claim checked
- US commercial crude at 428.910 million barrels on August 21, 2026 was reported as the 82nd percentile of the record and, elsewhere, as the 33rd. Readers asked which one is wrong.
- Result
- Neither is wrong. 1,885 of the 2,292 weeks since 1982 are at or below 428,910, which is 82.2 percent. 202 of the 609 weeks since January 2, 2015 are at or below it, which is 33.2 percent (33.1 with the record ending August 21, before the August 28 week landed). The cohorts disagree because 606 of the 609 weeks since 2015 sit above every single week before 2015; the floor moved. Separately, August 21 was 6.9 million barrels above its same-week five-year average and ranked 42nd of 45 Augusts, and the +17.4 million barrel build of August 7 was the 99.9th percentile of weekly changes onto a level in the 25th percentile of the modern cohort. Level, seasonal and change are three questions with three answers, printed apart.
Archive window, method and sources
- Archive window
- EIA Weekly Petroleum Status Report, commercial crude excluding the SPR (series WCESTUS1), every published week from August 20, 1982 to August 28, 2026: 2,292 weekly readings as stored in our table on September 9, 2026. The since-2015 cohort is the 609 of those weeks from January 2, 2015 onward. Weekly changes are ranked among the 2,291 week-on-week differences. EIA revises recent weeks in later releases and our ingest overwrites in place, so a rerun after a revision can move a count by a week.
- Documents examined
- The full stored series, recomputed in one pass on September 9, 2026, with the same rule the crude page uses: a percentile is the share of the cohort's weeks at or below the reading. 428,910 occurs exactly once, so the tie rule moves nothing. The same-week comparison uses the same ISO week (week 34, the numbered Monday-to-Sunday week of the year, so the same late-August slot every year) in the five prior years, and the all-years rank uses week 34 of every other year in the record.
6 of 6 sources archived with SHA-256 on September 12, 2026 · independent second read by Gemini 3.1 Pro on September 11, 2026: pass · revision 9
Commercial crude oil in US tanks stood at 428.9 million barrels in the week ending August 21, 2026. Ranked against every week the Energy Information Administration has published since August 1982, that is the 82nd percentile: a high reading, at or above 1,885 of 2,292 weeks. Ranked against the 609 weeks since January 2015, it is the 33rd percentile: a low reading, at or above only 202 of them. Both numbers are correct, and the question a reader should ask is not which one is wrong but which population each one is a share of.
What a percentile is a share of
A percentile is a fraction with a hidden denominator. The 82nd percentile means 82 percent of some set of readings sit at or below this one. Change the set and the fraction changes, with the barrels untouched. Our rule, on this page and on the crude inventory page, is the plain one: count the weeks in the cohort at or below the reading, divide by the weeks in the cohort. Ties count as at or below; 428,910 thousand barrels appears once in the record, so the rule moves nothing here.
The full record runs from August 20, 1982 to August 28, 2026 as we hold it on September 9, 2026: 2,292 weeks. 1,885 of them are at or below 428,910. That is 82.24 percent. The since-2015 cohort runs from January 2, 2015 to the same last week: 609 weeks, of which 202 are at or below. That is 33.17 percent. With the table ending August 21 instead, before the August 28 reading landed, the pair was 82.23 and 33.06, which is the 82.2 and 33.1 that circulated. The August 28 week (424.5 million) sits below August 21, so it adds one to the top and bottom of both fractions.
The two numbers do not disagree about the barrels. They disagree about what counts as company.
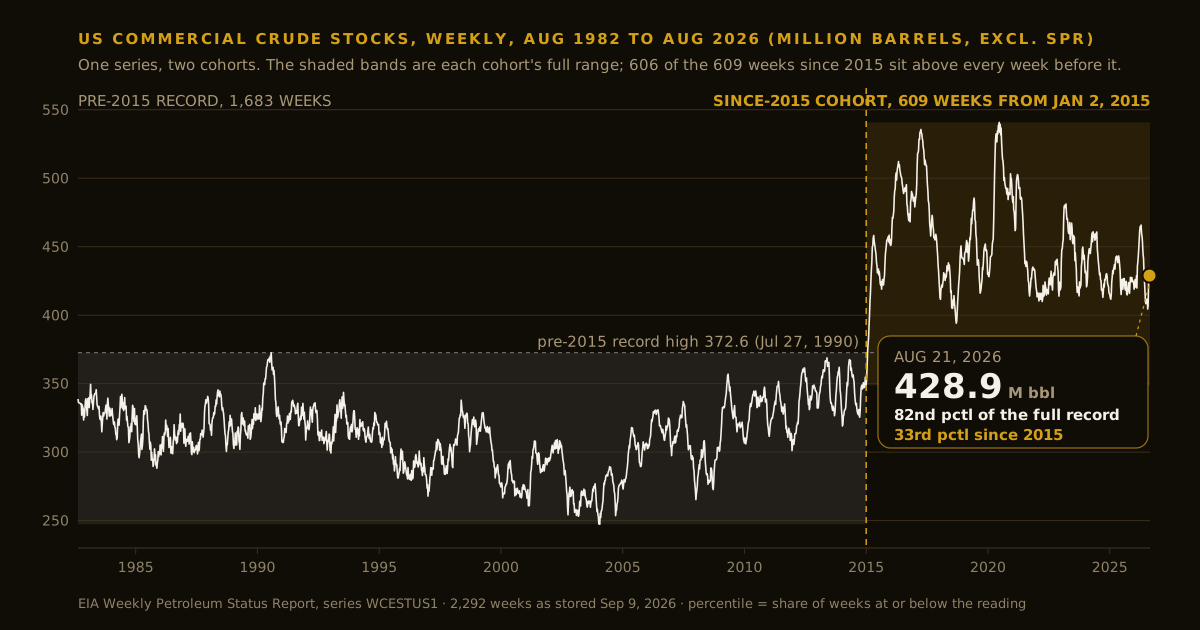
The floor moved: 606 of the 609 weeks since 2015 sit above every week before
From 1982 to 2014 the most crude ever held in US commercial tanks was 372.6 million barrels, in the week ending July 27, 1990. The median week of that era was 314.3 million. On January 23, 2015 the series cleared the 1990 record, and it has been above it in 606 of the 609 weeks since. The three exceptions are the first three weeks of January 2015. The median week since then is 441.7 million, 127 million barrels above the old median, a gap wider than the entire range of the old record.
Two things did that. Shale production took US crude output from about 5.5 million barrels a day in 2010 to over 13 million by 2024, and a system that produces, moves and exports more than twice as much oil needs more oil sitting in tanks and pipelines to run. And the tanks were built: the storage build-out at Cushing and along the Gulf Coast, the export terminals after the 2015 lifting of the crude export ban, the pipeline capacity that lets barrels wait where they are useful. Working storage is a piece of infrastructure, and there is a great deal more of it than there was.
That is why the same level reads two ways. Take a week from the old system: August 20, 2010, at 337.7 million barrels, the 64th percentile of the full record, a comfortable middle reading in its day. It is below every one of the 609 weeks since 2015. Take the low point of 2022, the week before the largest Strategic Petroleum Reserve release in the reserve's history was announced (180 million barrels, March 31, 2022; the reserve then fell 221.8 million barrels in the 52 weeks to January 6, 2023, the largest 12-month decline in the weekly SPR record we hold since August 1982 and more than three times the largest before it): 409.9 million on March 25, 2022. Full record, 74.5th percentile, an upper-middle reading. Since 2015, the 3.9th percentile, a level the modern system had only touched in its first weeks. The full-record number was not wrong about 2022. It was answering a question nobody was asking.
Why 2015, and why the old weeks are still here
Choosing a cohort is a decision, and a decision should be visible. Ours is a fixed date, January 1, 2015, written into the crude page's code as a named constant on September 1, 2026, and it was chosen for one measurable reason: it is the round date just before the series first cleared its own 1990 record and stayed there. It is not the year the regime changed; the build-out ran from roughly 2011 to 2016, and the start date decides how much of the old range the cohort still carries. Start it in 2011 and 74 percent of its weeks sit above the 1990 record; 2013, 85 percent; 2014, 92 percent; 2015, 99.5 percent; 2016, every week. January 1, 2015 is the first round date at which nearly the whole cohort clears the old ceiling. Since 2015 is a yardstick, not a finding.
What the cohort is not is a way to lose history. The full record is printed beside the modern percentile on every oil inventory page we run, every time, with its span. A reader who wants to know how today compares with 1985 can see it. A reader who wants to know whether today's tanks are full or empty by the standard of the system that exists now gets the cohort built for that question. The tell for a hidden replacement would be a percentile with no stated population. We do not publish one of those.
The same logic says when not to use it. The SPR is fixed caverns and a policy-set level, so its full record stands alone. Series that begin after 2010 are already modern; their full record is the cohort.
August, against other Augusts
Neither percentile says anything about the season, and crude has one. Refineries run hardest in summer and go down for maintenance in spring and autumn, so tanks drain into August and fill toward year end. The honest seasonal question is narrow: how does this August compare with other Augusts?
The crude page's rule takes the same ISO week, the numbered Monday-to-Sunday week of the year that the ISO 8601 calendar counts so that week 34 lands on the same late-August slot every year, in up to five prior years and subtracts their mean. For the week ending August 21, 2026 those are 425.4, 418.3, 422.9, 425.2 and 418.3 million barrels, a mean of 422.0, so August 21 is 6.9 million barrels above its same-week five-year average. Against every other year in the record, 44 of them with a week-34 reading, it ranks 42nd of 45: only 2016 (495.2), 2017 (457.8) and 2020 (507.8) had more crude in tanks in that week. That is a high August by the modern standard and nowhere near a record for the week.
The window matters, and it is worth saying so. A window of six years instead of five takes in August 2020, the COVID glut, and pulls the mean up to 436.3 million, which flips the sign: the same week reads 7.4 million below. One of our own surfaces, the weekly newsletter's grounding, uses that six-year window. This page uses the crude page's five-year rule, and says so, because a comparison that includes 2020 is answering a question about 2020.
A near-record build onto an ordinary level
The third question is the one that gets mixed in most often. A weekly build is a change, and a change has its own population: the 2,291 week-on-week differences since 1982. It is never ranked among levels.
In the week ending August 7, 2026, commercial crude rose by 17.4 million barrels. That is the 99.9th percentile of weekly changes, the fourth-largest build in the record behind February 26, 2021 (+21.6), April 10, 2020 (+19.2) and January 6, 2023 (+19.0). Since 2015 alone it is the 99.5th percentile. And it landed on a level of 424.4 million barrels: the 80th percentile of the full record, the 25th of the modern cohort. A near-record weekly build and an ordinary tank level, in the same row of the same table, both true, because one is a rate and the other is a stock. A bathtub filling fast is not a full bathtub.
February makes the same point from the other side. The week ending February 6, 2026 closed at 428.8 million barrels, within 0.1 million of the August 21 level, the same shelf six months apart: in percentile terms, 82.2 on the full record and 33.0 since 2015. It got there on a build of 8.5 million, the 96.9th percentile of weekly changes. Same level in February and August, different builds, and the level percentiles did not move because the level did not.
Method and receipts
Every figure here was recomputed in one pass on September 9, 2026 from our stored copy of EIA's weekly commercial crude series (WCESTUS1, excluding the SPR): 2,292 weekly readings from August 20, 1982 to August 28, 2026, every week EIA published in that span. The span holds 2,298 Fridays and EIA never published six of them (September 3, 10 and 17, 1982, and April 22, May 6 and May 27, 1983), so the count is 2,292, not 2,298; nothing after June 1983 is missing. A level percentile is the share of the cohort's weeks at or below the reading, ties included; a change percentile is the same rule over the 2,291 week-on-week differences. The same-week comparison uses ISO week 34 in the five prior calendar years, and the all-years rank counts strictly lower readings in week 34 of every other year. The crude page rounds the full-record percentile to the nearest integer and truncates the modern one, which is why it prints 82nd and 33rd. EIA revises recent weeks in later releases and our ingest overwrites in place, so a rerun after a revision can move a count by a week; the vintage of every number here is September 9, 2026.
The next reading is the report for the week ending September 4, 2026, and every one after it, on the crude inventory page, with both cohorts printed and the seasonal line beside them. This page does not carry the live number. It carries the reason there are two.
Sources
- EIA: Weekly Petroleum Status Report, the weekly release behind every reading here
- EIA: Weekly U.S. Ending Stocks excluding SPR of Crude Oil (WCESTUS1), the series, weekly from August 1982
- EIA: Working and Net Available Shell Storage Capacity, the storage build-out in the agency's own count
- EIA: U.S. Field Production of Crude Oil, annual, the shale-era output rise
- The Vault Report: US crude oil inventories, today's reading with both cohorts and the seasonal line
- The Vault Report: US oil inventory hub, every EIA weekly series we track
Frequently asked questions
- Is US crude oil inventory high or low right now?
- It depends on the population you rank it against, and the honest answer names it. For the week ending August 21, 2026, 428.9 million barrels of commercial crude (excluding the SPR) was the 82nd percentile of all 2,292 weeks EIA has published since August 1982 and the 33rd percentile of the 609 weeks since January 2, 2015. High against the old system, low against the modern one, both correct. The live reading, with both cohorts, is on thevaultreport.com/oil/crude.
- Why does The Vault Report rank crude against weeks since 2015?
- Because 606 of the 609 weeks since 2015 are higher than every single week before 2015. Shale output and the storage build-out lifted the floor: the pre-2015 record high was 372.6 million barrels (July 27, 1990) and the median week since 2015 is 441.7 million. A cohort that starts January 1, 2015 measures today against the system that exists now. The full record is printed beside it every time, with its span, so nothing is hidden.
More questions
- Is the 82nd percentile figure wrong?
- No. 1,885 of the 2,292 weekly readings from August 20, 1982 to August 28, 2026 are at or below 428,910 thousand barrels, which is 82.2 percent. It is a correct share of the full record. It is a poor guide to whether tanks are full by modern standards, because the modern range sits above nearly all of that record.
- Can a record weekly crude build happen at a normal inventory level?
- Yes, because a build is a change and a level is a stock, and they are ranked among different populations. In the week ending August 7, 2026 commercial crude rose 17.4 million barrels, the 99.9th percentile of the 2,291 weekly changes since 1982 and the fourth-largest build on record. The level it produced, 424.4 million barrels, was the 25th percentile of the since-2015 cohort. Level percentiles and change percentiles are never mixed.
- What does the same-week five-year comparison add?
- The season. Crude stocks drain into late summer and fill toward year end, so a reading is compared with the same ISO week in the five prior years. For August 21, 2026 those Augusts averaged 422.0 million barrels and the reading was 6.9 million above them; against week 34 of every year in the record it ranked 42nd of 45. That is a separate question from either percentile, and a window that includes 2020 (six years) flips the sign, which is why the window is stated.
- Does the crude inventory percentile predict the oil price?
- We do not claim that. A percentile describes where a reading sits in a named population of past readings. It is a description of the tanks, not a forecast of the price, and nothing on this page is investment advice.